There Are Two Types of Websites
One looks good. It earns trust, it has a wow factor, and agencies charge a lot of money for it. If you want to know what that actually looks like done well, we broke one down in our Function Health website teardown.
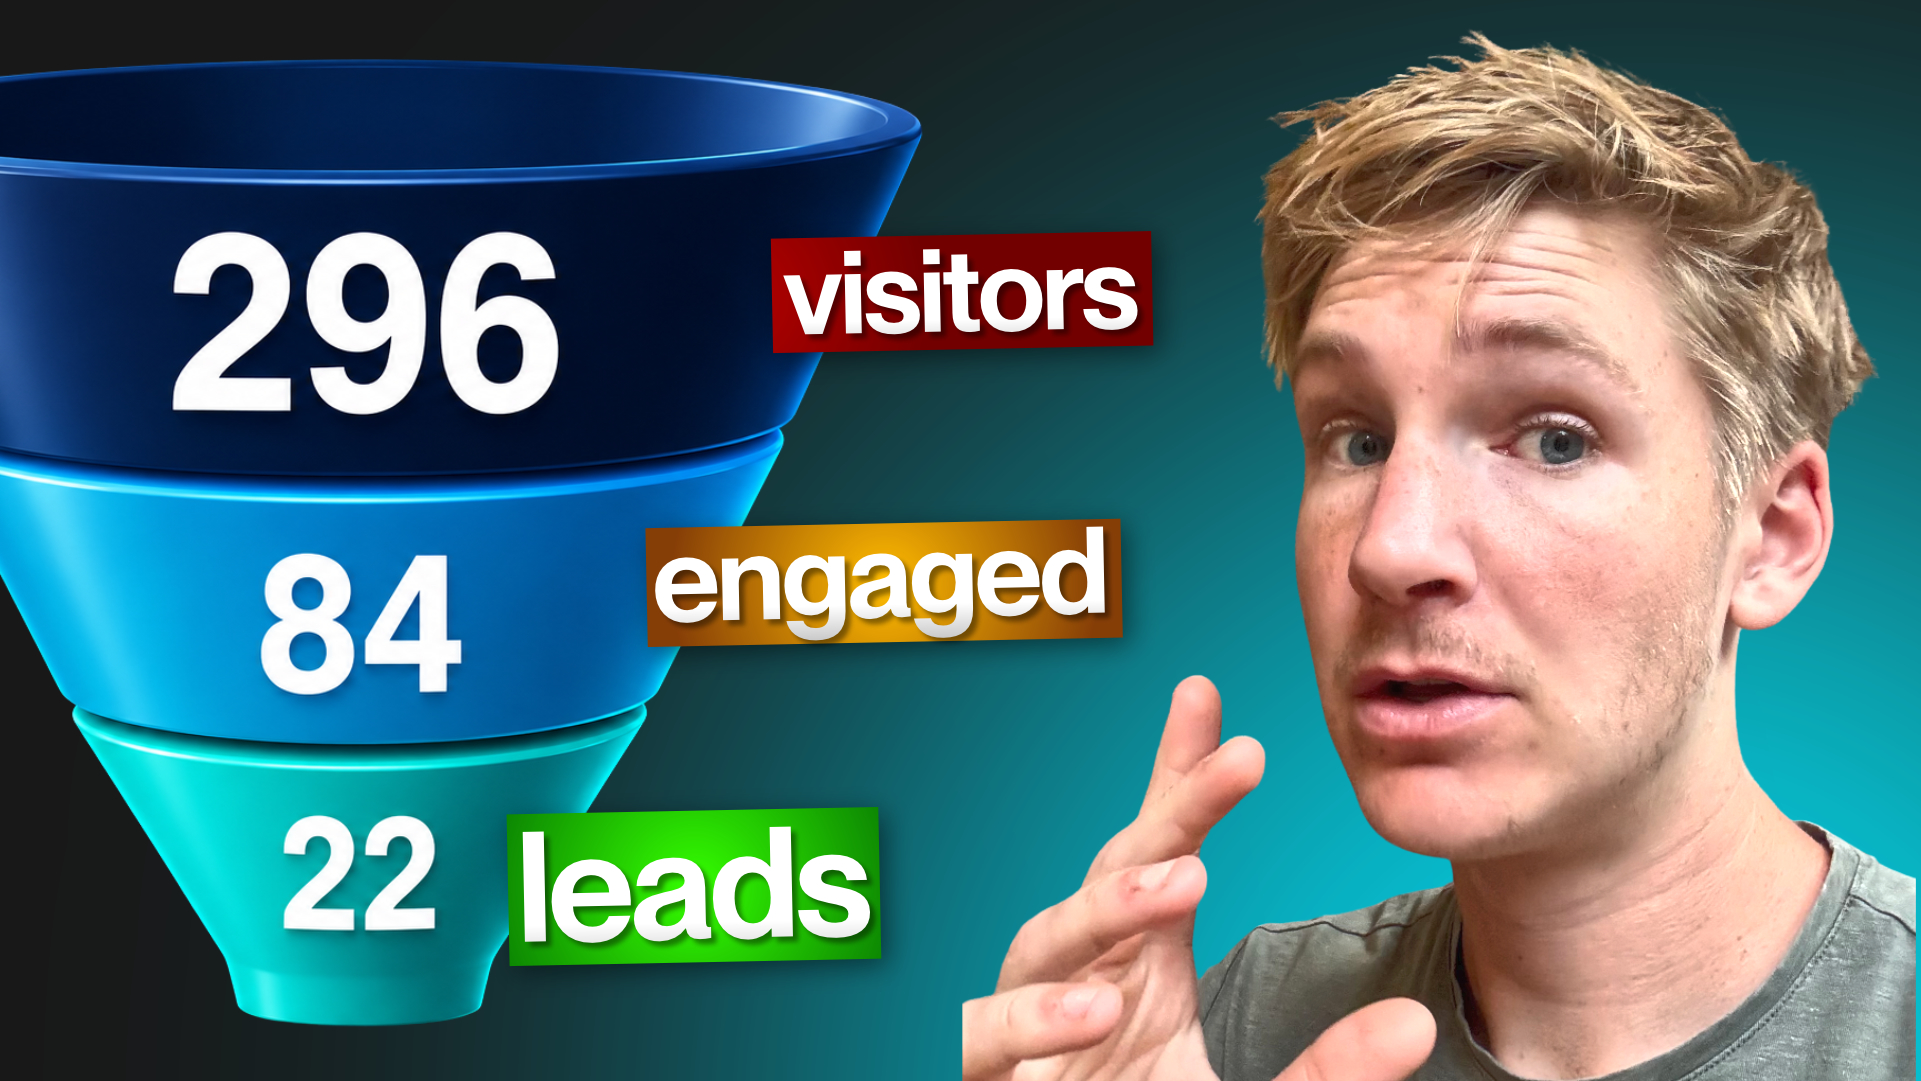
The other type of website is a sales funnel. Not a metaphor. An actual funnel, the same way a sales pipeline is a funnel, with real stages and real people dropping out at each one.
Most marketing teams have the first kind and think they have the second. If you've read our piece on why most B2B healthcare websites fail at converting visitors into leads, you already know the gap usually isn't design. It's visibility. Teams can't see what's actually happening on their own site, so they can't fix it.
The Parked Car Problem
Most companies treat their website like a car parked in the driveway. Washed, waxed, looks great from the street. People walk by, admire it, keep walking.
It's not going anywhere.
What if that car was actually on the road, driving customers to your door, and you had a real dashboard telling you exactly how fast it's moving and where it's losing fuel. That's the difference between a website that represents you and a website that works for you.
Here's how we build that dashboard for our clients, and how you can start building visibility into your own three stages.
Stage One: Visitors
Every funnel starts with people finding you. These are your marketing qualified leads. They've willingly entered your brand's orbit. They searched something, clicked a link, found you somehow, and they're in the consideration phase of their journey with you.
Most companies stop their reporting right here. Traffic went up, traffic went down, that's the whole conversation. We go a level deeper and track exactly which keywords are bringing people in, using SE Ranking data pulled straight into the dashboard, and whether that visibility is trending up or down over time. We're also watching whether clients show up in AI search results, since that's becoming the new front door. We wrote about our approach to that in our exact AI search strategy for 2026.
If your traffic is up but it's all coming from one keyword, that's not a strength. That's a risk you need to know about.
Stage Two: Engaged Sessions
Stage two is engagement, and it's the stage most reporting completely falls apart on.
An engaged session is someone who clicked to more than one page, or came back to the site more than once. Not someone who landed and left in three seconds. A real person who actually looked around and read your content, which is becoming rarer on websites every year.
We show clients which pages actually hold attention, not just which pages get the most views. Those are two different things. A page can get a thousand visits and hold nobody. A page can get a hundred visits and hold everybody. Google Analytics 4 and Microsoft Clarity both feed this layer of the dashboard, so you can see scroll depth, session counts, and whether people are clicking on something that looks broken.
None of this works if visitors can't trust what they're looking at once they arrive. We cover that side of the equation in why your website betrays trust, and how to actually stand out.
Stage Three: Converted
This is the stage that actually matters to a CEO. Not sessions. Not engagement. Did any of this turn into business.
A converted visitor is someone who took action according to a metric you've defined. A form submission. A visit to a contact page. A meaningful amount of dwell time on a pricing page. A scroll depth on a launched sales page, if you want to see whether people are actually reading the copy so you can remarket to them. Whatever counts as a real signal for your business, you define it, and the dashboard tracks it as a conversion event.
This is also where you connect the dots backward. For one client, we saw 20 of 285 visitors over 70 days land on the contact form. When we traced those 20 back to their source, 12 came from direct search, meaning they had the brand bookmarked or searched it by name, 6 came from organic search, and the rest split across referral and LinkedIn. That single breakdown told the client exactly which channel was producing qualified traffic, not just traffic.
If you want to go deeper on identifying who those visitors actually are before they ever fill out a form, we tested seven tools for that in how to identify anonymous website visitors.
Why We Won't Let the Data Lie to You
Here's the part we care about more than any dashboard screenshot. When we build a report comparing performance before and after a launch or a redesign, we do not claim the redesign caused the growth unless the evidence actually supports it. We'll tell you what changed, what's correlated, and what we can't prove yet.
A report that's always positive isn't a report. It's a sales pitch, and you can't defend a sales pitch to your CEO. You can defend evidence. That distinction matters even more once you understand what actually drives conversion rate. We dug into that with Brian Massey of Conversion Sciences, who has run over 35,000 tests generating more than a billion dollars in new revenue, in what a billion dollars in A/B tests taught him about B2B websites.
Where to Start
Visitors. Engaged sessions. Converted. Three stages, one connected story, real data.
Step one is making sure you have tracking infrastructure in place at all. Some of the marketing teams we talk to don't have basic analytics set up. Step two is defining what a conversion actually means for your business, a form fill, a contact page visit, a resource download, whatever signals real intent.
Once you have that, you stop guessing about what to fix and start seeing exactly where people drop out of your funnel and why.
We build this exact system for B2B healthcare companies. If you want visibility into your own three stages, take a look at our healthcare website design services or see how our full website design and development process works, and let's talk about what your site is actually doing right now.








.webp)
.webp)